I love Venn diagrams. I even wrote about how to make lovely 2-way and 3-way Venn diagrams with this brilliant Python package (link here). BUT, 4-way Venn diagrams just don't work! And if you want more than that, you run into some problems. I wish such >3-way Venn diagrams did work, but you lose the ability to make the size of the circles relate to the number in each set. Not only that, but you have to position the circles in weird places and use strange (non-circle) shapes. See the famous banana Venn diagram from the publication of the banana genome by D'Hont et al. (2012):

But what is the alternative? Well, you can make an UpSet plot. This is a plot that can scale; I personally prefer Venn diagrams when intersecting 2-3 samples, but when I have to look at more, UpSets is the best. UpSets has an interactive website that allows you to make your own UpSet plots you might want to use (here). This post will instead focus on how to use the R package to make UpSet plots (here). Apparently a Python version has also been released, but I have not yet had chance to learn how to use this (here).
To install the latest release of UpSetR (only needs to be done the first time you use UpSetR):
$ install.packages("UpSetR")
Now we can load UpSetR in the usual way:
$ library(UpSetR)
From RStudios, you can launch really details of how to use UpSetR in your web browser as so:
$ browseVignettes("UpSetR")
Then we can load the dataframe of interest, in this case it is filled with imaginary genes from magical creatures of whom we can pretend I did genome sequencing of. The data can be found here for you to use at home. To load the data, do as so:
$ FantasticBeasts_df <- read.table(file = "Fantastic_beasts.txt", header = T, sep = "\t")
Each column of this table is a different list of genes. Some genes will be found in different fantastic beasts (Dragon, Unicorn, House Elf, Goblin, Manticore or Blast-ended Skrewt). I find that the format that UpSetR wants is a bit strange. But it will take lists of IDs (eg genes) and convert this into its prefered format. To do this, use the fromList function when you make a plot:
$ upset(fromList(FantasticBeasts_df), order.by = "freq")
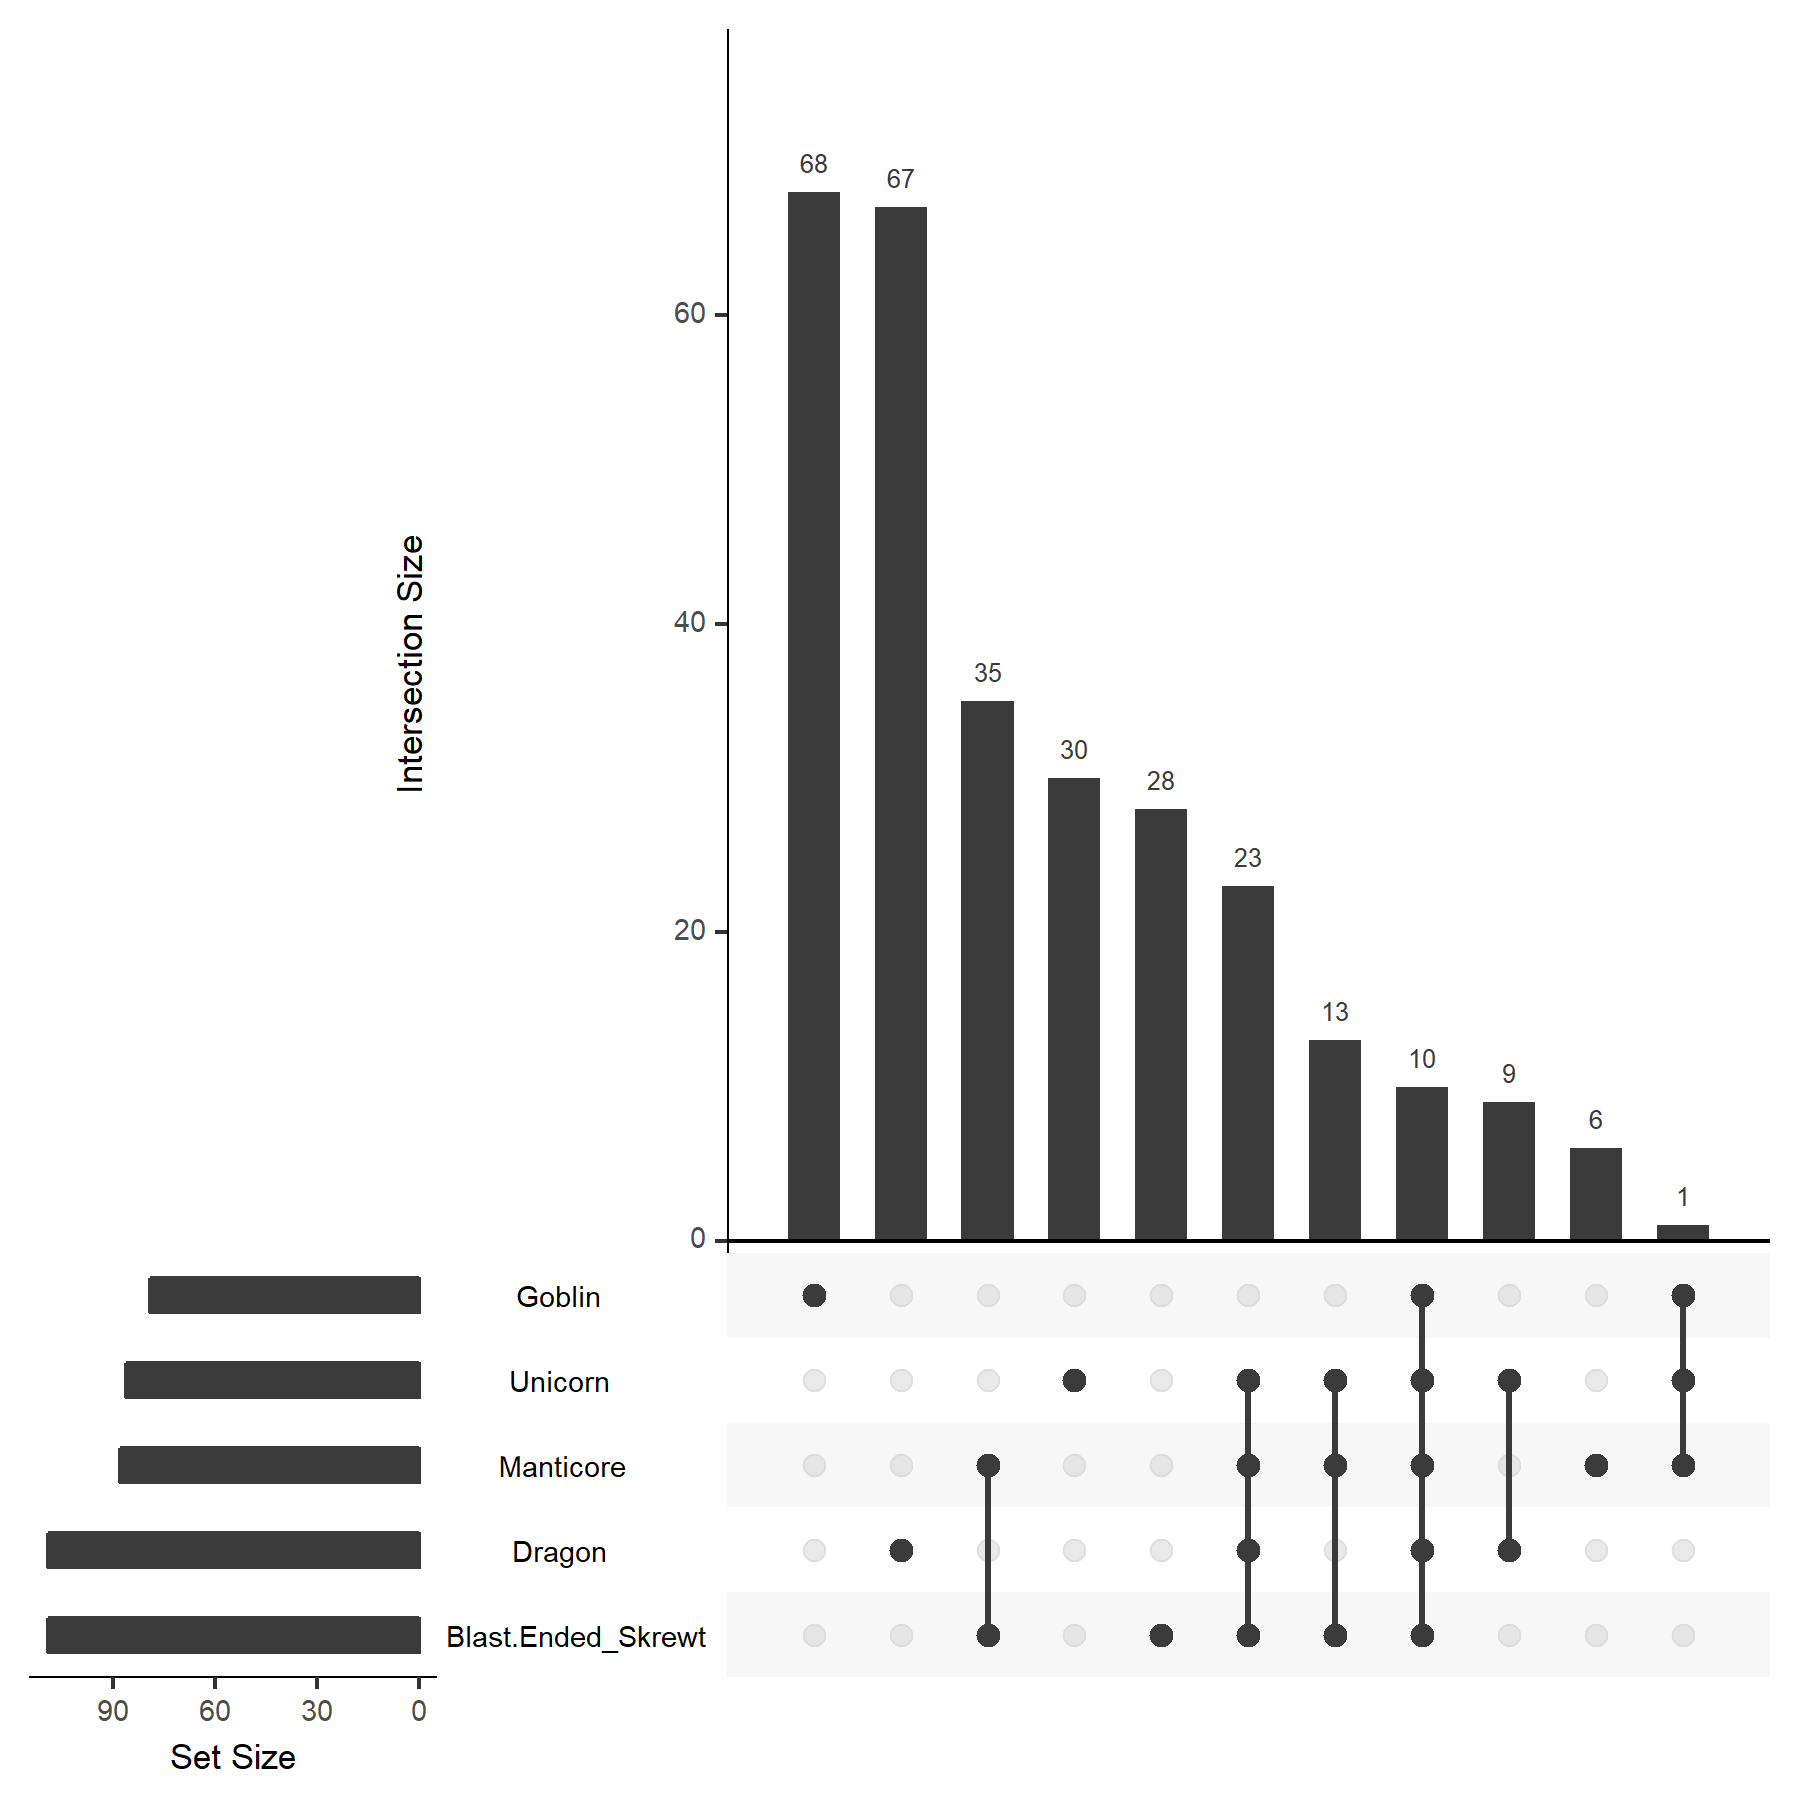
Now we have our first UpSet plot. Great! You can clearly see the fractions of genes unique to one species, and how many are shared between different creatures. However, as you can see, House Elves are missing from the plot! As if House Elves do not have it hard enough (S.P.E.W. for life!). The reason that they are missing is because by default uses some method to calcualte which to show. You can force it to show all sets (samples/species) by setting the nset paramater to the number of sets you have in your data (in our case here, six). So let's try this again:
$ upset(fromList(FantasticBeasts_df), order.by = "freq", nsets = 6)

Much better. Now House Elves are getting the respect that they deserve. And we can see a few interesting results from this. First, we see that these magical creatures generally do not share a lot of core genes, and most genes are distributed to individual species (or groups) rather than all sharing a large number of common genes. Clearly something interesting going on with the biology of these creatures ;-). Second, Dragons have a very high number of unique genes. Perhaps because they have a number of adaptations that others here do not, strong skin, reptile-like features, wings (although manticore have wings, but I think it is likely they came about independently), and fire breathing. Third, House Elves and Goblins are very similar in gene content to each other, likely because both are bipedal, highly intelligent and can cast spells. Fourth, Manticores and Blast-ended Skrewts are also very similar to each other; this should come as no surprise given that Blast-ended Skrewts are a hybrid of Manticores and Fire Crabs. If Fire Crabs had been included in this study, Blast-ended Skrewts might not have had any unique genes.
Already you can see that with a six-way comparison, an UpSet plot is far more informative than an attempted six-way Venn diagram. On the left-hand side of the sets, we can see set size. If one set had a massive number of genes compared to the others, we could see that here. We can see that Dragons and Blast-ended Skrewts do have more genes than others but this difference is not huge. But what if we do not like the ordering of the intersections? Currently, we set this to by frequency (size) of the intersection, the largest being to the left. We can change this. Ordering by "degree" rather than "freq" will mean that the intersections overlapping the most sets will be left most now:
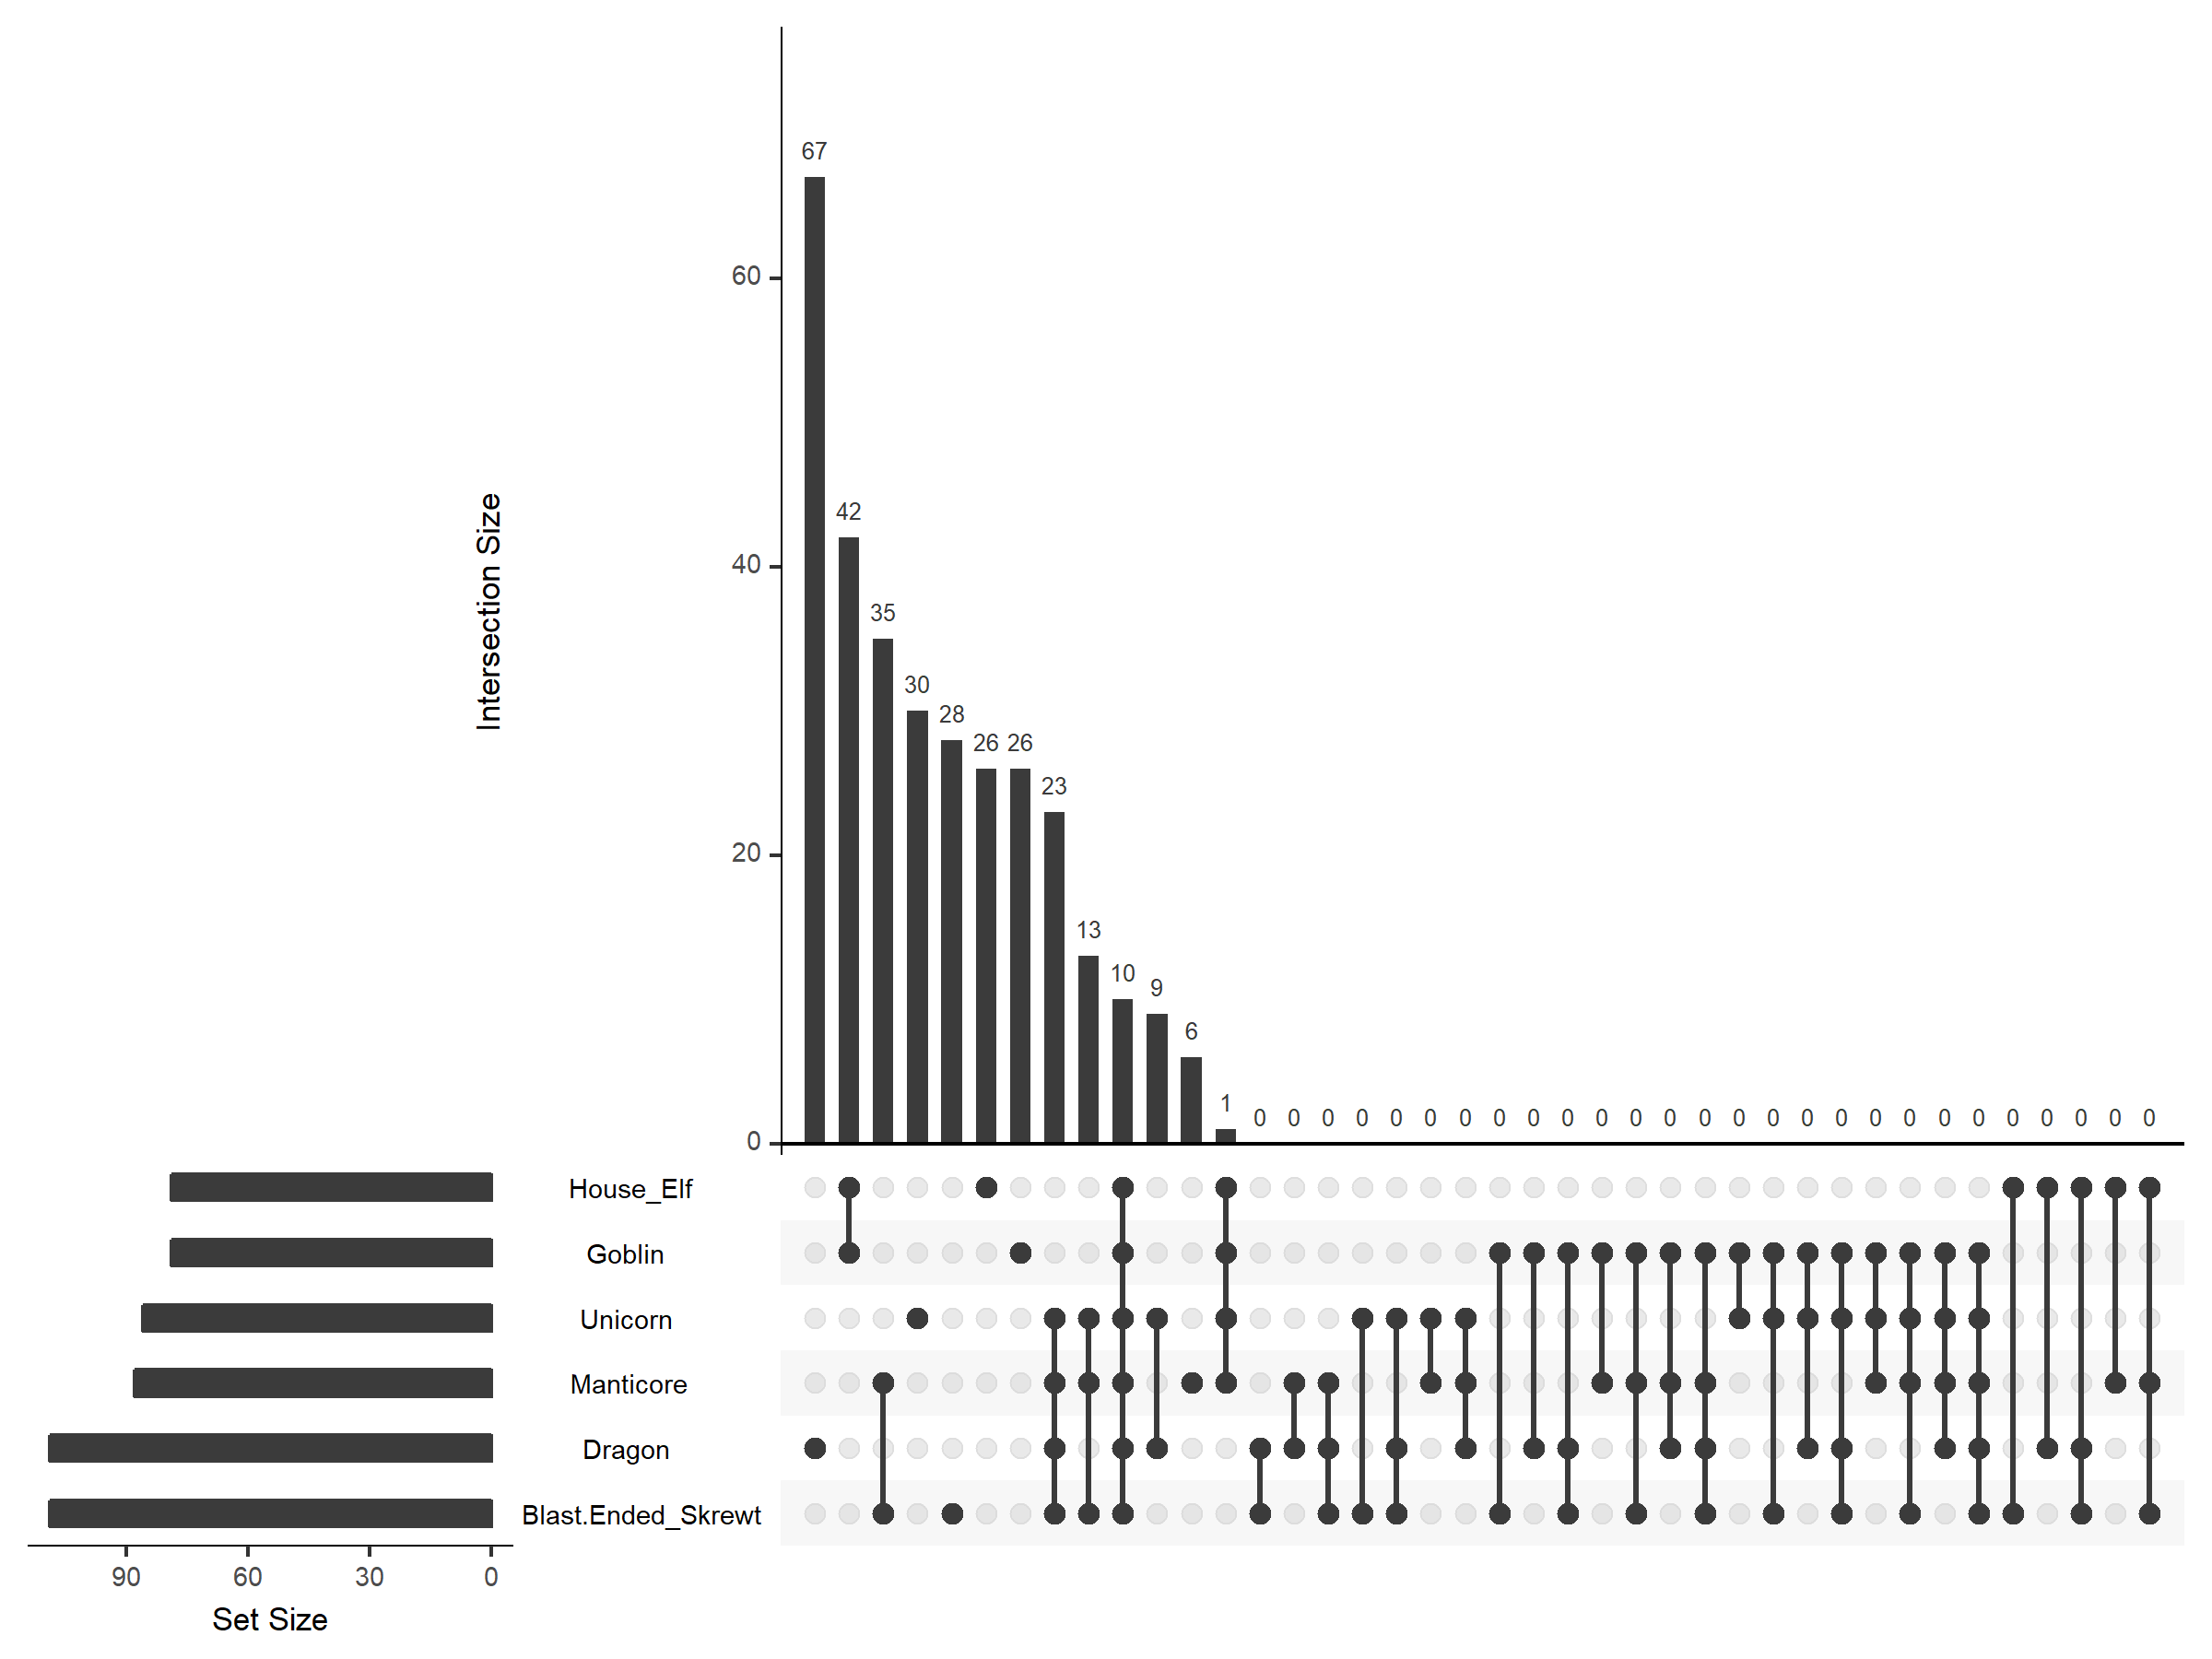
$ upset(fromList(FantasticBeasts_df), order.by = "degree", nsets = 6)

This is good if you can to prioritise the degree of similarity (or lack thereof). If you wanted to show all of the intersections without any genes, you can do this with the empty intersections parameter:
$ upset(fromList(FantasticBeasts_df), empty.intersections = "on", order.by = "freq", nsets = 6)
This isn't very useful in this case, but with other datasets, could be a valuable thing to include. Now we have covered the basics of making UpSet plots in R. There is a lot more to be done with these if you are feeling brave; certainly check out the Vignette for more details. And good luck on improving your data vis skills.
Note on saving high res images in RStudios: it is not possible to get print quality images from saving images generated in the bottom right hand section of RStudios. You can however, add these lines of code above (png("FantasticBeast4.png", width = 8, height = 6, units = 'in', res = 300)) and below (dev.off()) your plotting function. For example, to save a high quality image file:
$ png("FantasticBeast1.png", width = 6, height = 6, units = 'in', res = 300)
$ upset(fromList(FantasticBeasts_df), order.by = "freq")
$ dev.off()
To save a vector based image (PDF; useful for making figures for publication):
$ pdf("FantasticBeast1.pdf", width = 6, height = 4)
$ upset(fromList(FantasticBeasts_df), order.by = "freq")
$ dev.off()
This can be used for any plot in R, not just UpSet plots.
Details about UpSets from the creators (definately check out):
http://caleydo.org/tools/upset/
UpSets article:
http://ieeexplore.ieee.org/document/6876017/?reload=true
UpSetR (R package) article:
https://academic.oup.com/bioinformatics/article/33/18/2938/3884387
Short video on UpSets:
https://www.youtube.com/watch?v=D9Cf9lnv8bk&feature=youtu.be
For a discussion on how to pull out overlaps from UpSets, check this out (thanks to @OliverBerkowitz for pointing this out to me):
https://github.com/hms-dbmi/UpSetR/issues/85